Australian SMS Marketing Statistics 2026
Most SMS statistics pages recycle the same decade-old American numbers. This page is different. Every statistic below comes from real SMS campaigns sent by Australian businesses on Mobile Message.
That means Australian senders, Australian recipients, Australian carriers, and honest methodology. Where something can't be measured directly, we say so. You're welcome to cite any statistic on this page, and we explain exactly how each number was produced in the methodology section.
- How Australian businesses actually use SMS
- Reply rate benchmarks
- The best (and worst) day to send
- Personalisation lifts replies by 56%
- Longer messages get more replies
- Delivery rates and list hygiene
- Opt-out benchmarks
- The SMS marketing calendar
- Why we don't publish an open rate
- Methodology
- Frequently asked questions
How Australian businesses actually use SMS
61% of campaigns go to fewer than 100 recipients. The popular image of SMS marketing is the mass blast, but the data shows the opposite. Australian business SMS is dominated by small, targeted sends to a business's own customers, like appointment lists, member groups, and repeat buyers.
57% of campaigns are sent in a way that can't receive replies. A third of campaigns (33%) send from a business-name sender ID, which recipients cannot reply to, and another 24% send from the business's own mobile number, where replies bypass the platform. Only 44% send from a dedicated or shared virtual number that supports two-way messaging. If replies matter to your campaign, this is the first setting to check.
Friday is the busiest send day, and 10 to 11am is the busiest window. Campaign volume peaks on Fridays, with secondary peaks at 4pm AEST. If you want your message to land when inboxes are quieter, mid-morning Tuesday to Thursday combines lower crowding with the strongest engagement figures below.
17% of campaigns are scheduled in advance, and those campaigns are roughly twice the size of send-now campaigns (an average of 949 recipients vs 499). Larger senders plan; smaller senders fire when ready.
Reply rate benchmarks
Measured across campaigns sent from reply-capable numbers, the average Australian campaign earns 1.44 replies per 100 messages, and about 6 in 10 campaigns receive at least one reply. For campaigns of 100 or more recipients, 7 in 10 get replies.
The single biggest factor is campaign size. Small campaigns behave like conversations, and big campaigns behave like broadcasts:
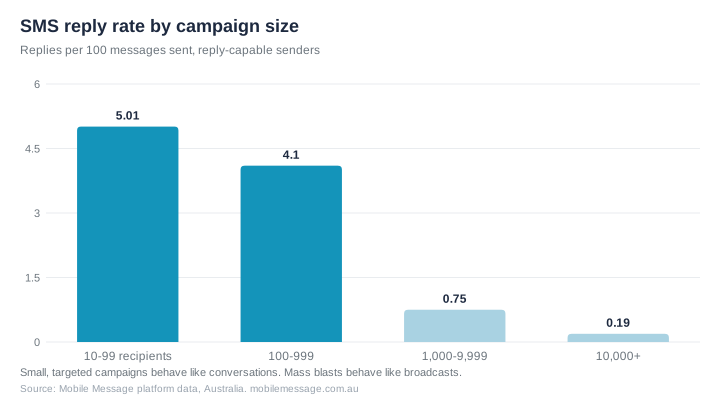
A campaign of 10 to 99 recipients averages 5 replies per 100 messages, which is 26 times the rate of a 10,000+ blast. The lesson for marketers is segmentation. Five targeted sends of 200 will out-engage one blast of 1,000 every time.
The best (and worst) day to send
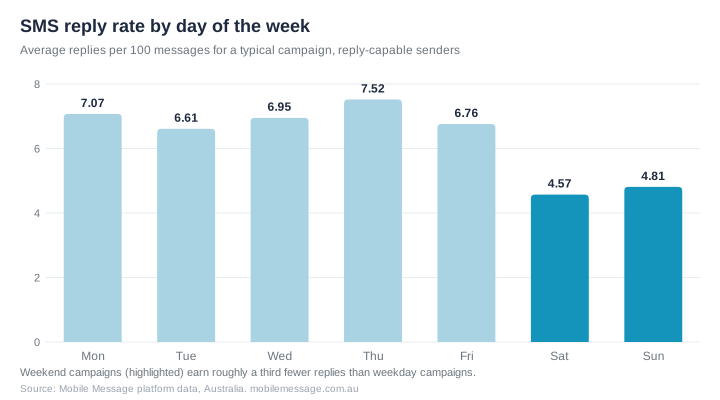
Weekday campaigns consistently out-perform weekend campaigns, and it isn't close. A typical weekday campaign earns 6.6 to 7.5 replies per 100 messages, while weekend campaigns manage only 4.6 to 4.8. Thursday tops the table, but the honest reading is that any weekday performs well.
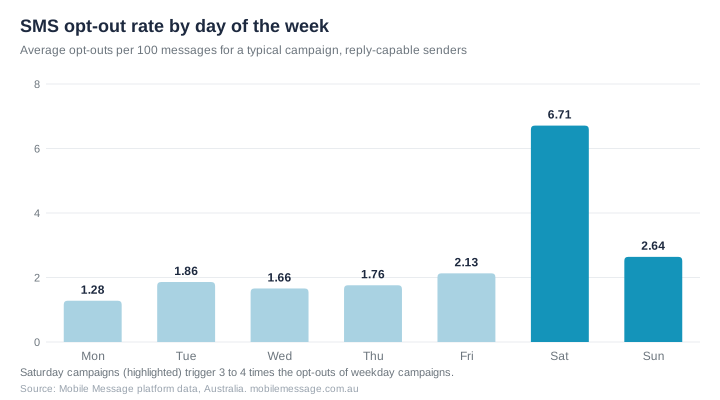
The weekend penalty is even sharper on opt-outs. Saturday campaigns average a 6.7% opt-out rate, which is 3 to 4 times weekday levels. People guard their weekends, and a promotional text on a Saturday is far more likely to earn a STOP than a sale.
Personalisation lifts replies by 56%
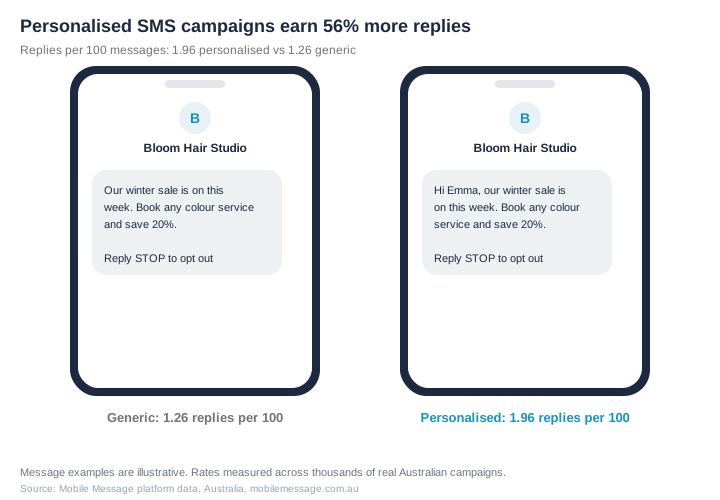
Campaigns that use the recipient's first name earn 1.96 replies per 100 messages against 1.26 for generic campaigns, a 56% lift. In a channel where every message looks the same, a name is the cheapest attention signal available.
Longer messages get more replies
Marketing folklore says to stay under 160 characters so the message costs one credit. The data disagrees on outcomes. Campaigns over 160 characters earn 2.4 times the replies of single-segment campaigns (2.21 vs 0.90 per 100 messages), and 54% of Australian campaigns already run past 160 characters.
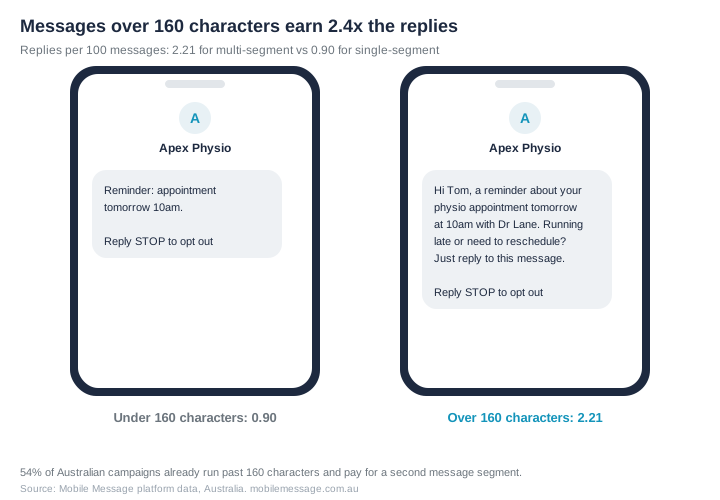
Longer messages carry more context, a clearer reason to respond, and room for a proper call to action. At 2¢ to 4¢ per SMS, the second segment often costs less than the reply it wins.
Delivery rates and list hygiene
Delivery in Australia is high but not uniform, and the difference is list quality. Campaigns under 100 recipients average 95.8% delivery, while campaigns over 10,000 average 89.8%.
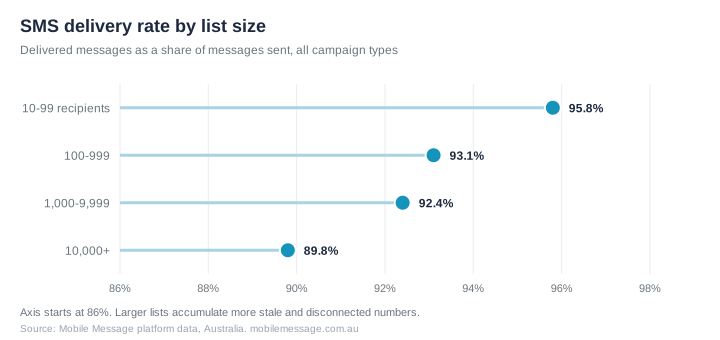
Small lists are usually recent customers with current numbers. Big lists accumulate years of disconnected numbers, typos, and churned customers. If a tenth of a large list is dead, you're paying for messages nobody can receive, so pruning undeliverable numbers is one of the few SMS optimisations that pays for itself immediately.
Opt-out benchmarks
Opt-outs are the price of admission in SMS marketing, and knowing the normal range matters more than fearing them. A typical weekday campaign sees 1.3% to 2.1% of recipients opt out. Weighted across all messages the average is 3.1%, dragged up by a minority of large, high-churn sends.
Three patterns raise opt-outs well above the normal band: sending on Saturdays (6.7% average), oversized generic blasts, and messaging lists that haven't heard from you in a long time. All three are avoidable.
Under the Spam Act, every marketing SMS needs a working unsubscribe facility. Mobile Message handles opt-outs automatically, so a STOP reply or an opt-out link tap instantly removes the contact from future sends.
The SMS marketing calendar
November is the biggest SMS month of the Australian year, and June is second. Black Friday drives November: in 2025 it carried twice the messages of the September and October average before it. End of financial year drives June, which ran 1.7 times its April and May average in 2026, and 1.9 times the year before. Retailers dominate the first, and services businesses chasing pre-EOFY bookings drive the second.
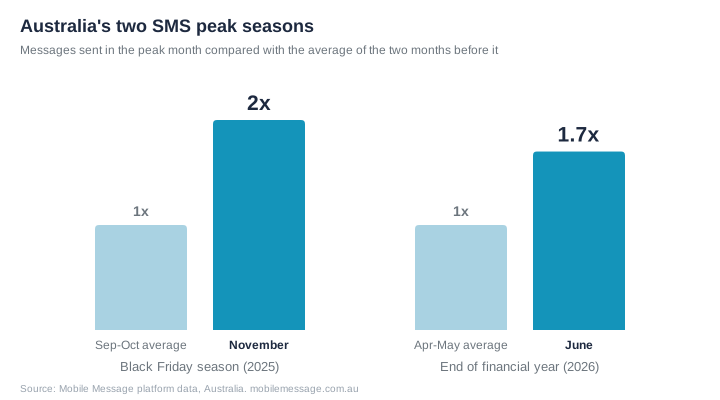
If your business runs Black Friday or EOFY campaigns, the practical implication is to build your list and register your sender ID well before the peak, since everyone else's messages are landing in the same week.
Why we don't publish an open rate
SMS is widely credited with an open rate of around 98%, far ahead of email. It's a reasonable estimate, since text messages appear directly on the lock screen. What it can't be is a measured platform statistic, because SMS has no read receipts, so no provider can directly measure opens.
Since every number on this page comes from measured platform data, open rate isn't one of them. The measurable numbers are delivery rate (did it reach the phone), reply rate (did it start a conversation), and opt-out rate (did it cost you the subscriber), and those are what we report.
Methodology
All statistics are drawn from real campaigns recently sent through Mobile Message, an Australian SMS platform. A campaign is a single send to 10 or more recipients.
Engagement statistics (reply rates, opt-out rates, personalisation, and message length effects) are calculated only from campaigns sent from dedicated or shared virtual numbers, because business-name sender IDs and personal mobile numbers cannot receive replies through the platform. Including them would understate true engagement.
Reply figures count reply messages, not unique responders, so we report "replies per 100 messages" rather than response rates. Day-of-week engagement figures are per-campaign averages, which stops a handful of very large campaigns from distorting the picture. Delivery rates count carrier-confirmed deliveries across all campaign types. Seasonal comparisons measure each peak month against the months immediately before it, which removes the effect of platform growth.
No message content or recipient details were accessed in producing these statistics. All figures are aggregates.
Frequently Asked Questions
What is a good SMS reply rate in Australia?
The average campaign earns 1.44 replies per 100 messages. Small campaigns of 10 to 99 recipients average 5 replies per 100, while campaigns over 10,000 recipients average 0.19. If your mid-sized campaigns earn 2 to 4 replies per 100 messages, you're in the healthy range.
What is the average SMS opt-out rate?
A typical weekday campaign sees 1.3% to 2.1% of recipients opt out. Saturday campaigns average 6.7%, so if your opt-outs look high, check your send day before blaming your content.
What is the best day and time to send SMS marketing?
Tuesday to Thursday, mid-morning. Weekday campaigns earn roughly 50% more replies than weekend campaigns, and Saturday combines the lowest reply rates with opt-out rates 3 to 4 times weekday levels.
What is the average SMS delivery rate in Australia?
Between 89.8% and 95.8% depending on list quality. Fresh, small lists deliver at 95%+, while large lists that haven't been cleaned in years sit closer to 90% because of disconnected numbers.
Does personalisation actually work in SMS?
Yes. Campaigns using the recipient's first name earn 56% more replies than generic campaigns (1.96 vs 1.26 replies per 100 messages).
What is the open rate of SMS?
SMS is widely credited with an open rate of around 98%, and it's a reasonable estimate given messages land directly on the lock screen. It can't be measured directly though, because SMS has no read receipts. Delivery, replies, and opt-outs are the measurable metrics, and they're what this page reports.
Can I cite these statistics?
Yes, please do. Cite "Mobile Message, Australian SMS Marketing Statistics 2026" and link to this page. If you need a cut of the data we haven't published, get in touch and we'll see what we can share.
Put the benchmarks to work
Mobile Message is Australia's cheapest bulk SMS service, with a first purchase at just 1.6¢ per SMS and a free dedicated number so your campaigns can actually receive replies. Start with 50 free SMS credits, no credit card required.